
What MaxDiff, segmentation, TURF and brand recall reveal about how customers really choose.
November 13, 2026 | BY JOSEPH DONNELLY, QWERRY
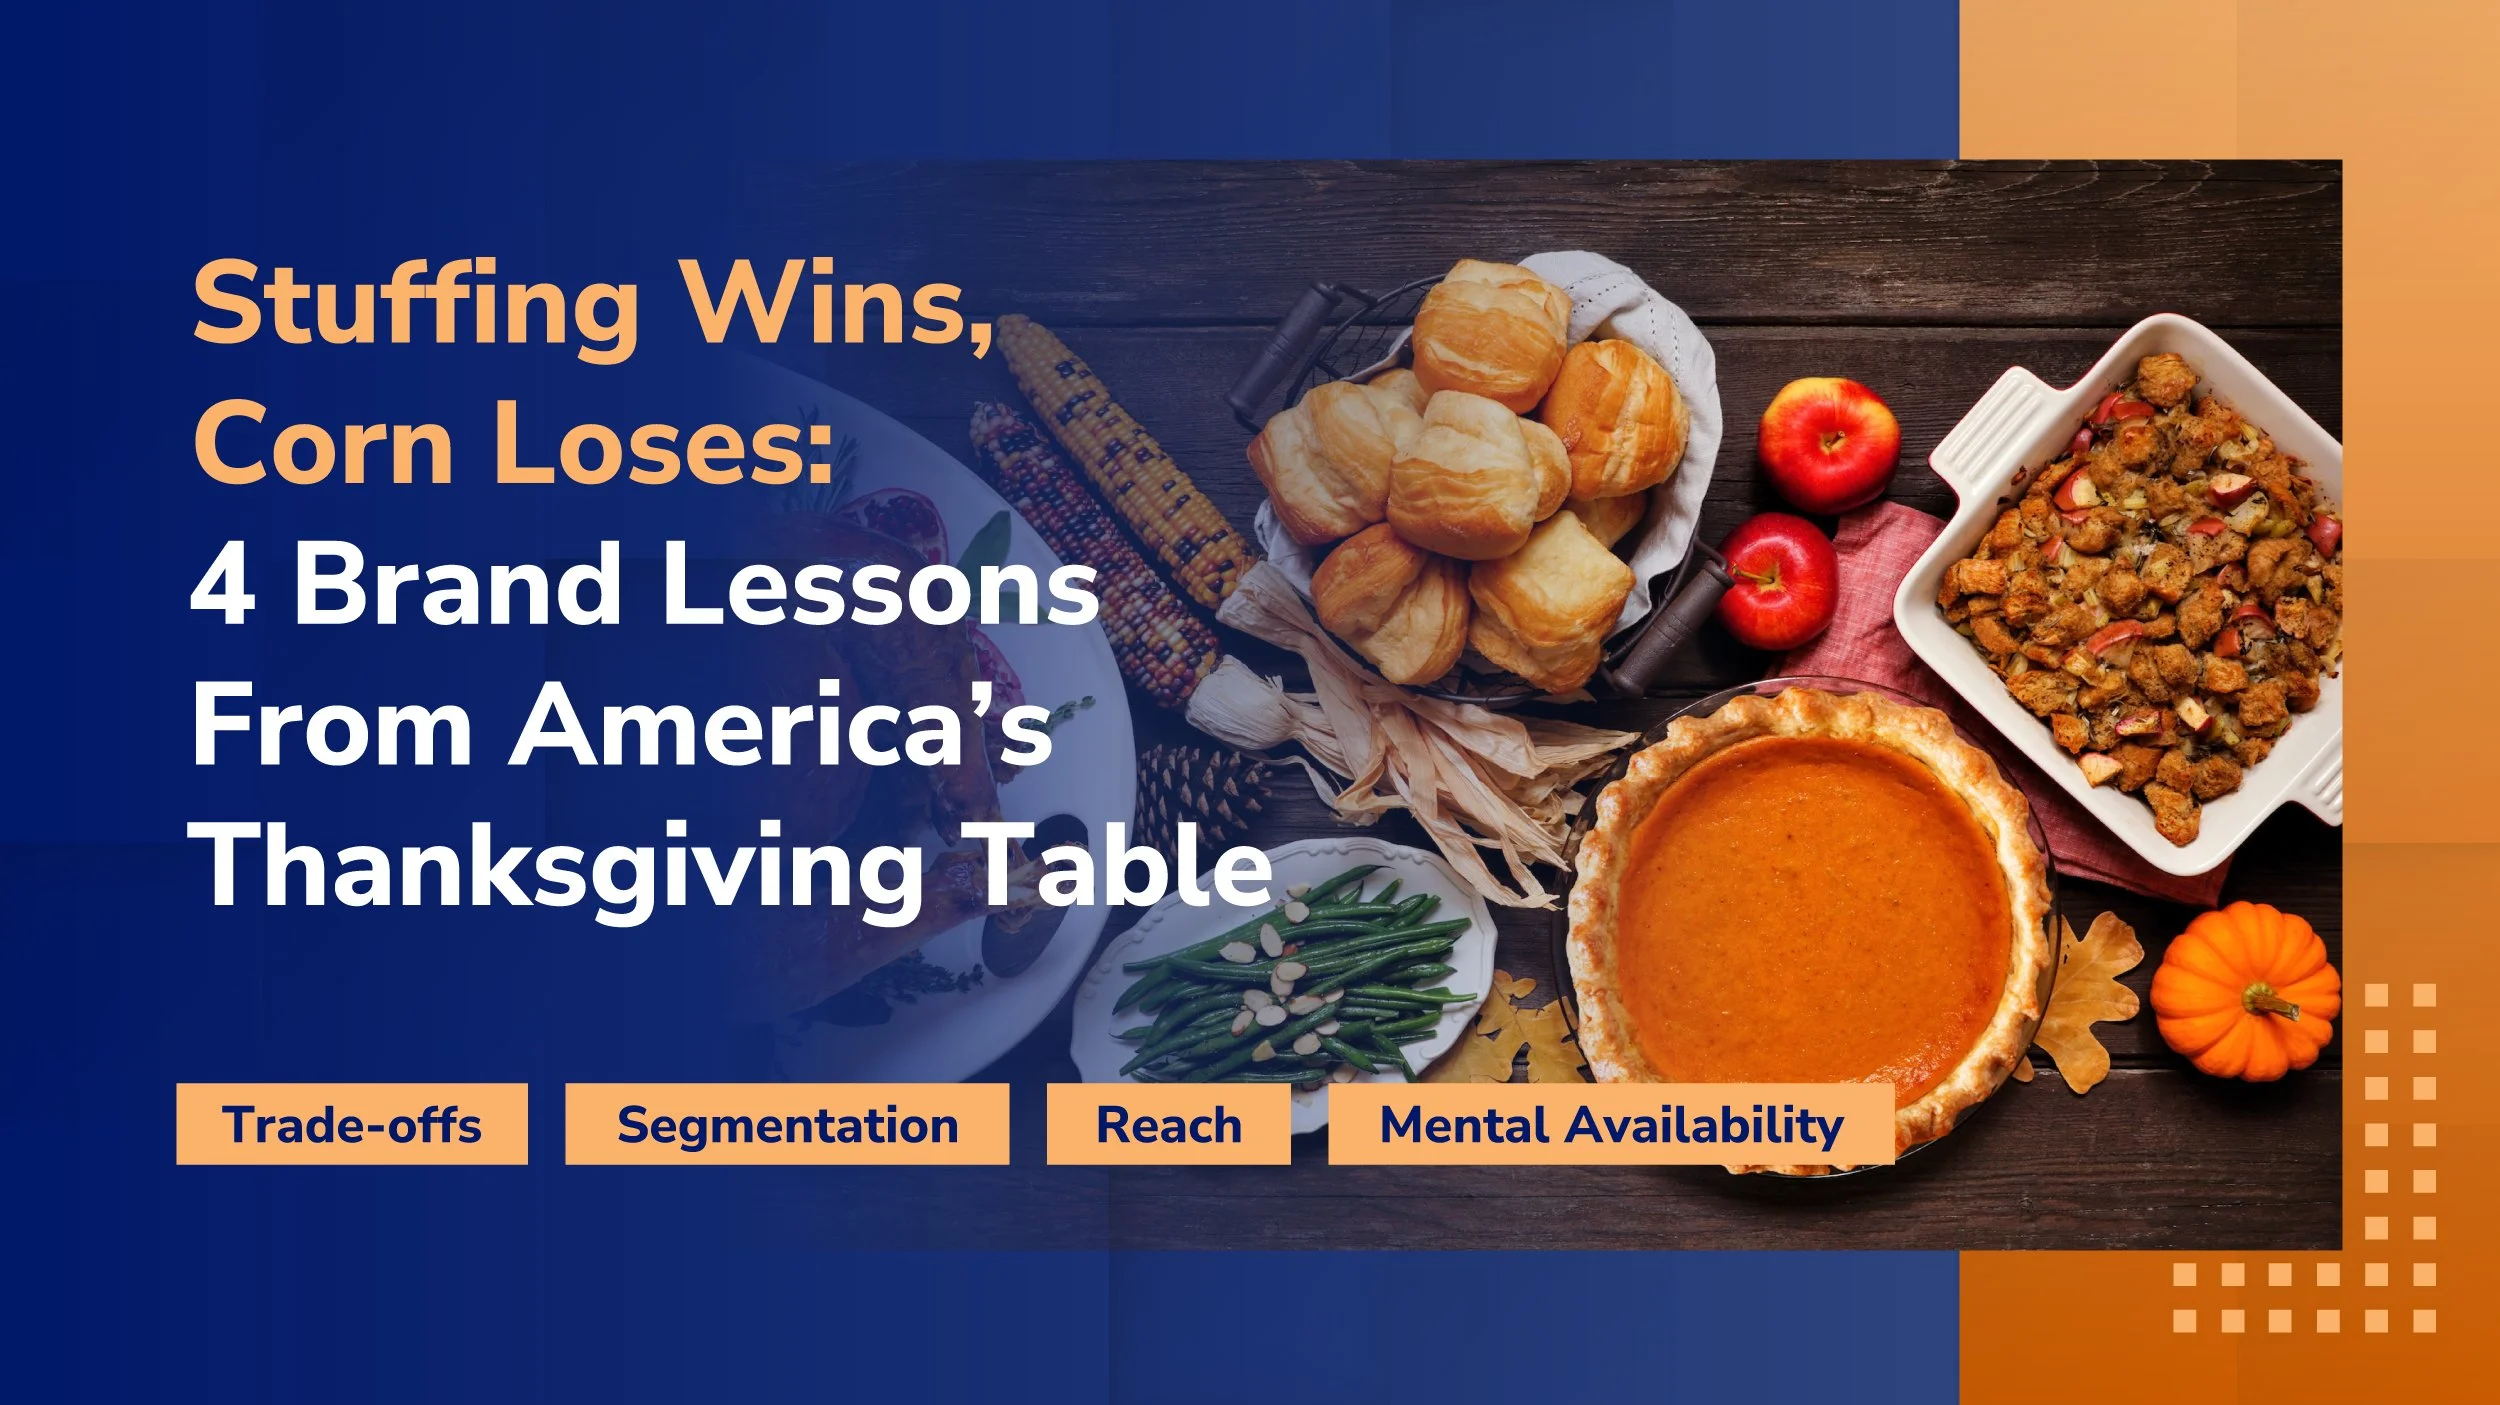
Stuffing is America's favorite Thanksgiving side, corn is loved but rarely picked when forced to choose, and mac & cheese is next in line for the crown. Those are just some of the fun findings from our 2026 Thanksgiving Table Study.
What’s more useful than the findings themselves is how we found them. Each one comes from a different market research method, and each method teaches a lesson brand leaders can use well beyond the holiday table.
Here are the four lessons, each shown through our Thanksgiving Table Study results:
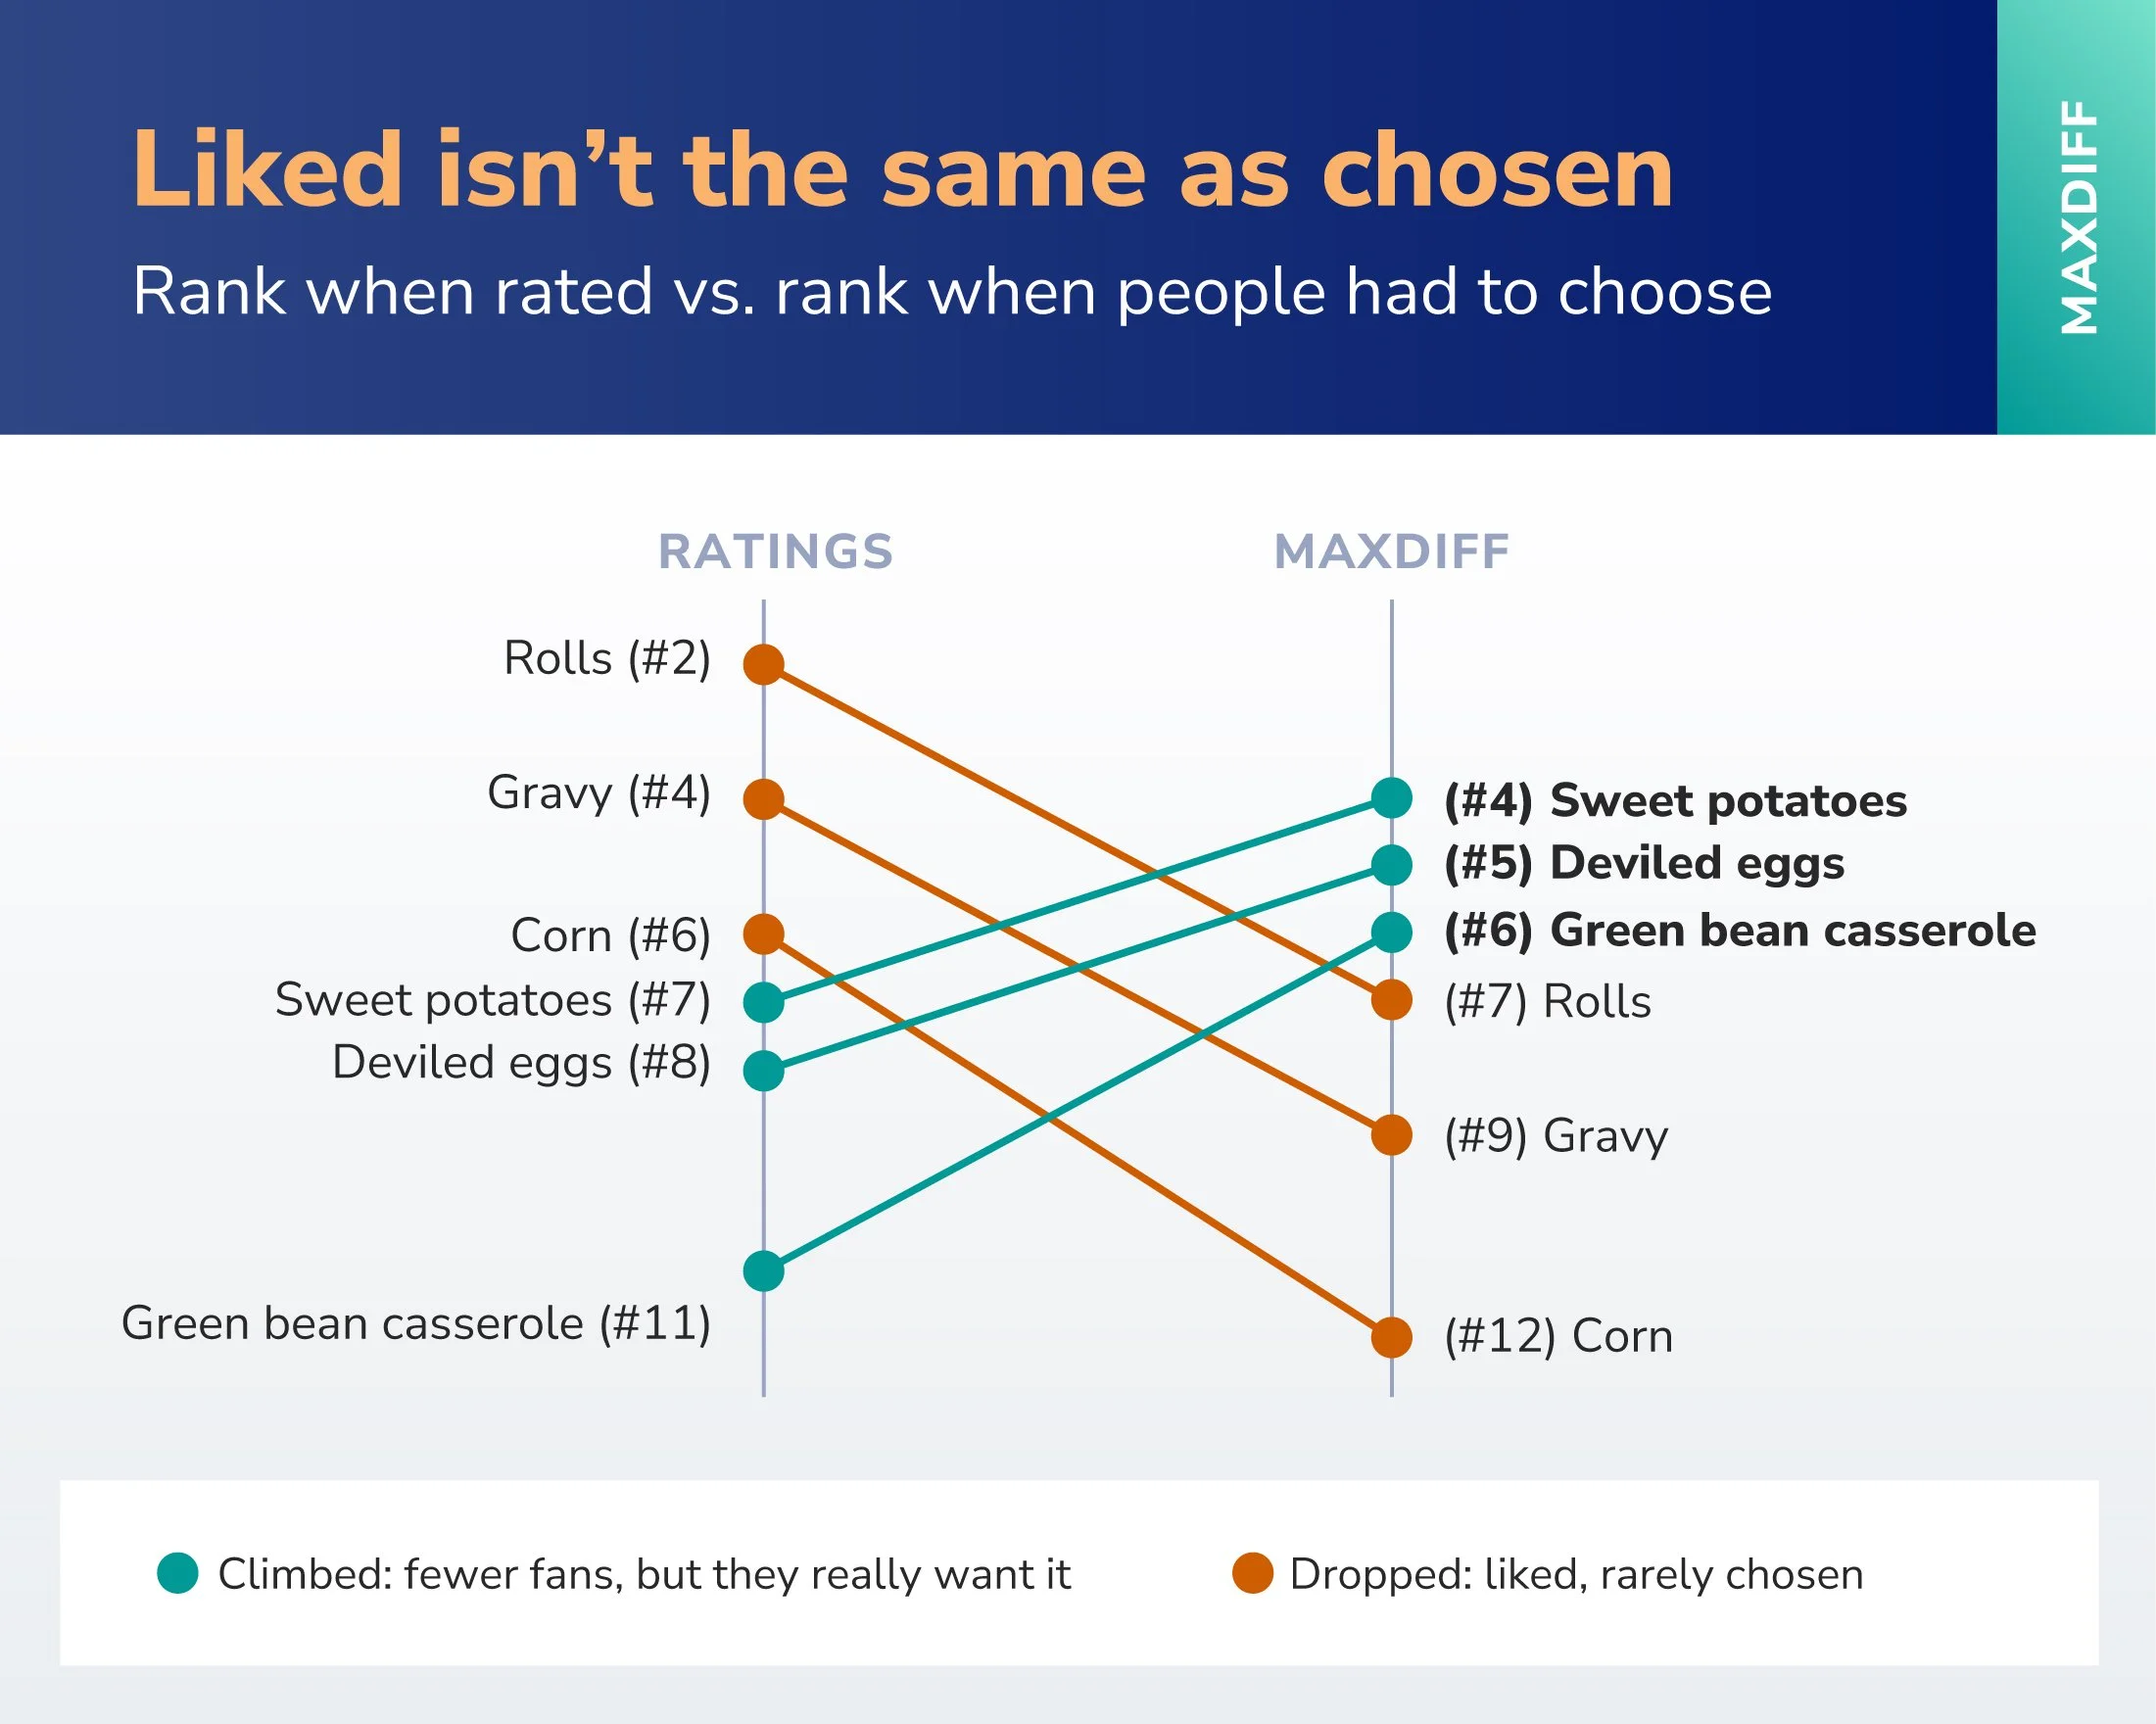
What people say they like isn't always what they choose. Corn is liked or loved by 83% of people, yet it ranks twelfth of 13 sides when people have to choose between them.
Averages can hide the real story. Stuffing is the national favorite, but among adults under 45, mac & cheese is the most preferred side.
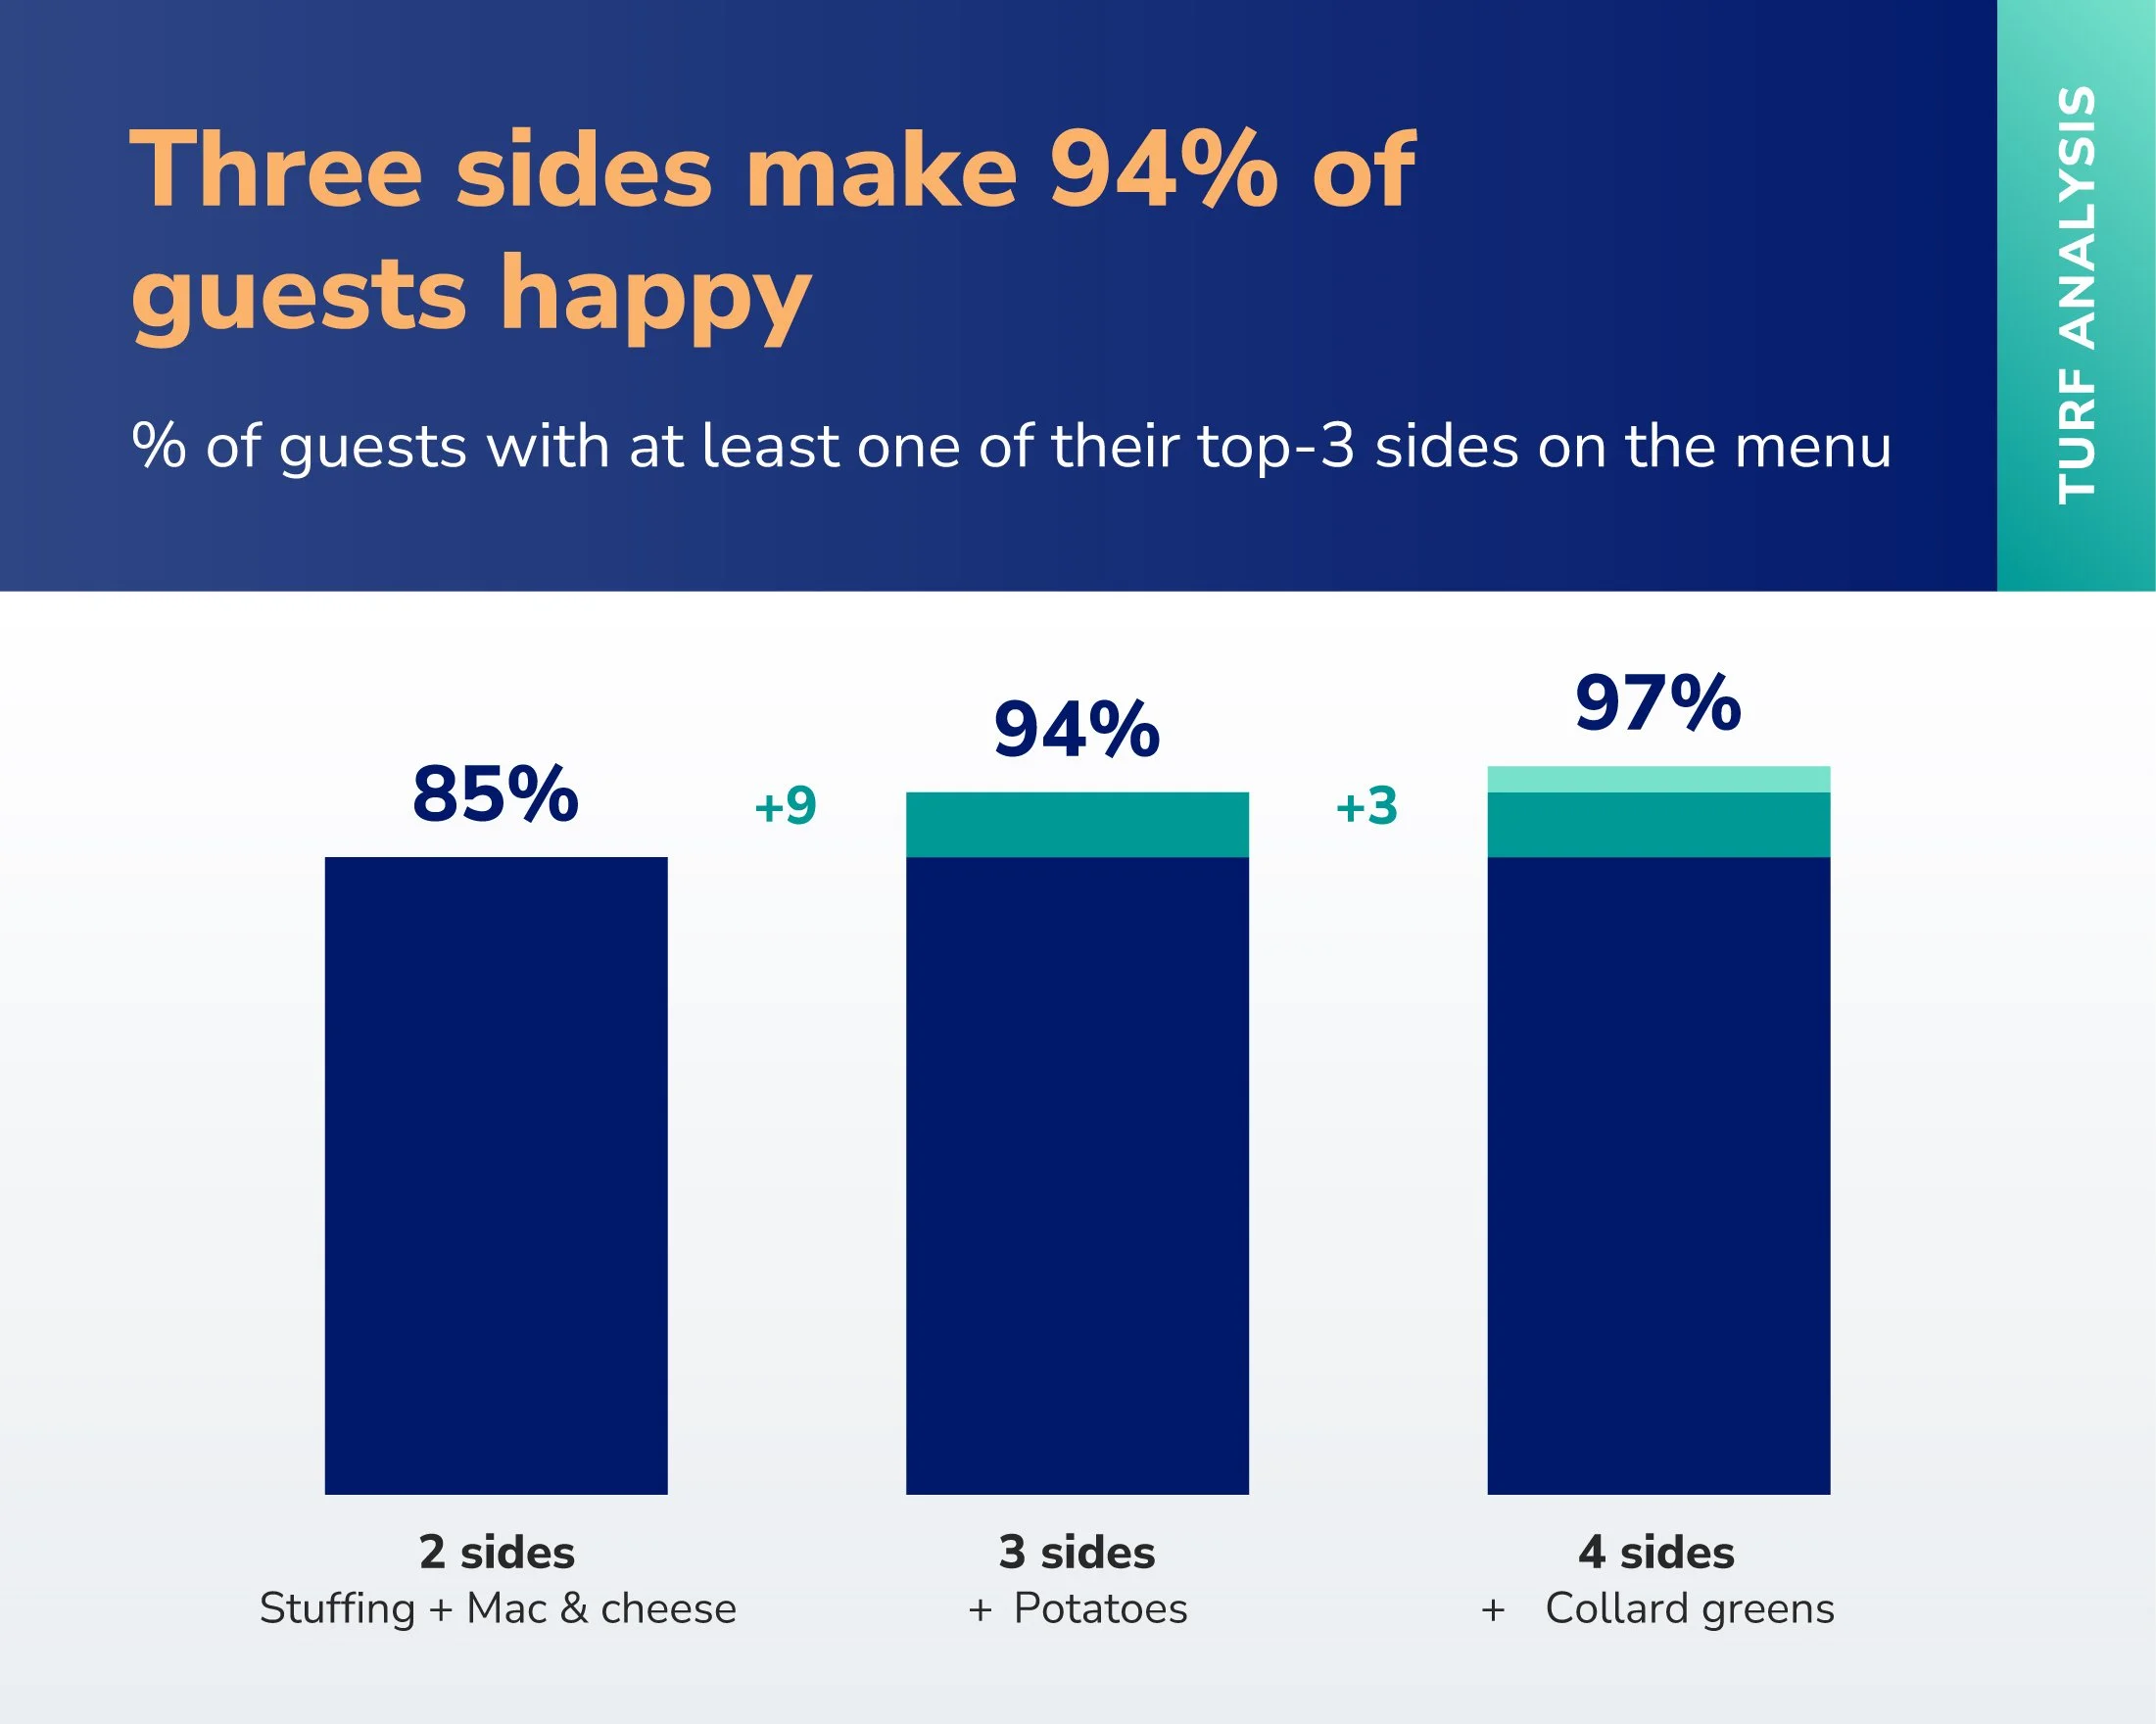
What’s most popular may not give you the most reach. Potatoes and rolls are the two most-loved sides, but TURF analysis shows stuffing and mac & cheese together reach 85% of guests.
Being remembered is its own advantage. Unaided recall shows Butterball owns the Thanksgiving moment: one in three people who named any brand, in any category, named Butterball.
MAXDIFF
Lesson 1: What people say they like isn't always what they choose
We asked about 13 sides two ways. First, a simple rating: “love it,” “like it,” or “take it or leave it.” The ratings told us very little. The average person said they "love" about half of the sides, with potatoes, rolls, stuffing and gravy all loved by about two-thirds of people. When everything is loved, nothing really wins.
Expecting this, we also asked people to choose between sides using a trade-off exercise known as MaxDiff.
WHAT IS MAXDIFF?
MaxDiff (maximum difference scaling) is a trade-off research method. People see a small set of options, here five sides at a time, and pick the one they'd most want and the one they'd skip, over several rounds. Because they can't say yes to everything, the results help us uncover true preferences rather than general approval.
HOW BRAND LEADERS USE IT.
Ask customers to rate product features, benefits or messages, and they'll usually rate all of them highly. An exercise like MaxDiff forces trade-offs, so you can separate the true drivers worth leading with from the "corn": features people like or expect but rarely choose for.
One way MaxDiff results are reported is by preference share. Each side gets a share of total preference, and the 13 shares add up to 100%, so if every side were wanted equally, each would get about 8%. They aren't. Stuffing alone takes 25% and is the clear winner, while the least-preferred side earns less than 2%. That makes the top side roughly 15 times as preferred as the bottom one. In the simple ratings, results are much harder to discern with the most-loved side only about 2.5 times as loved as the least.
Corn is the clearest case of this gap. Eighty-three percent of people like or love corn, yet it falls from sixth in the ratings to twelfth in MaxDiff, with just 2% of preference share. Salad follows the same path: 76% like or love it, but it earns under 3% preference share. These sides are pleasant and easy to agree to, but they're rarely the reason anyone looks forward to the Thanksgiving meal.
The opposite happens with dishes people feel strongly about. Green bean casserole moves from eleventh in the ratings to sixth in MaxDiff. Sweet potatoes move from seventh to fourth, nearly tied with regular potatoes, and deviled eggs from eighth to fifth. Fewer people love these dishes, but the ones who do really want them on the table.
Rolls and gravy drop too, from second and fourth in the ratings to seventh and ninth. That one we could have guessed: gravy needs something to pour on, and a roll is just a roll. When a method agrees with common sense on the obvious items, you can trust it on the ones that aren't as obvious.
SEGMENTATION ANALYSIS
Lesson 2: Averages can hide the real story
Nationally, stuffing is the clear winner with 25% of preference share, and mac & cheese is a distant second at 16%. Split the results by age, and the picture changes: the older the group, the bigger stuffing's lead, and among adults under 45, mac & cheese comes out on top.
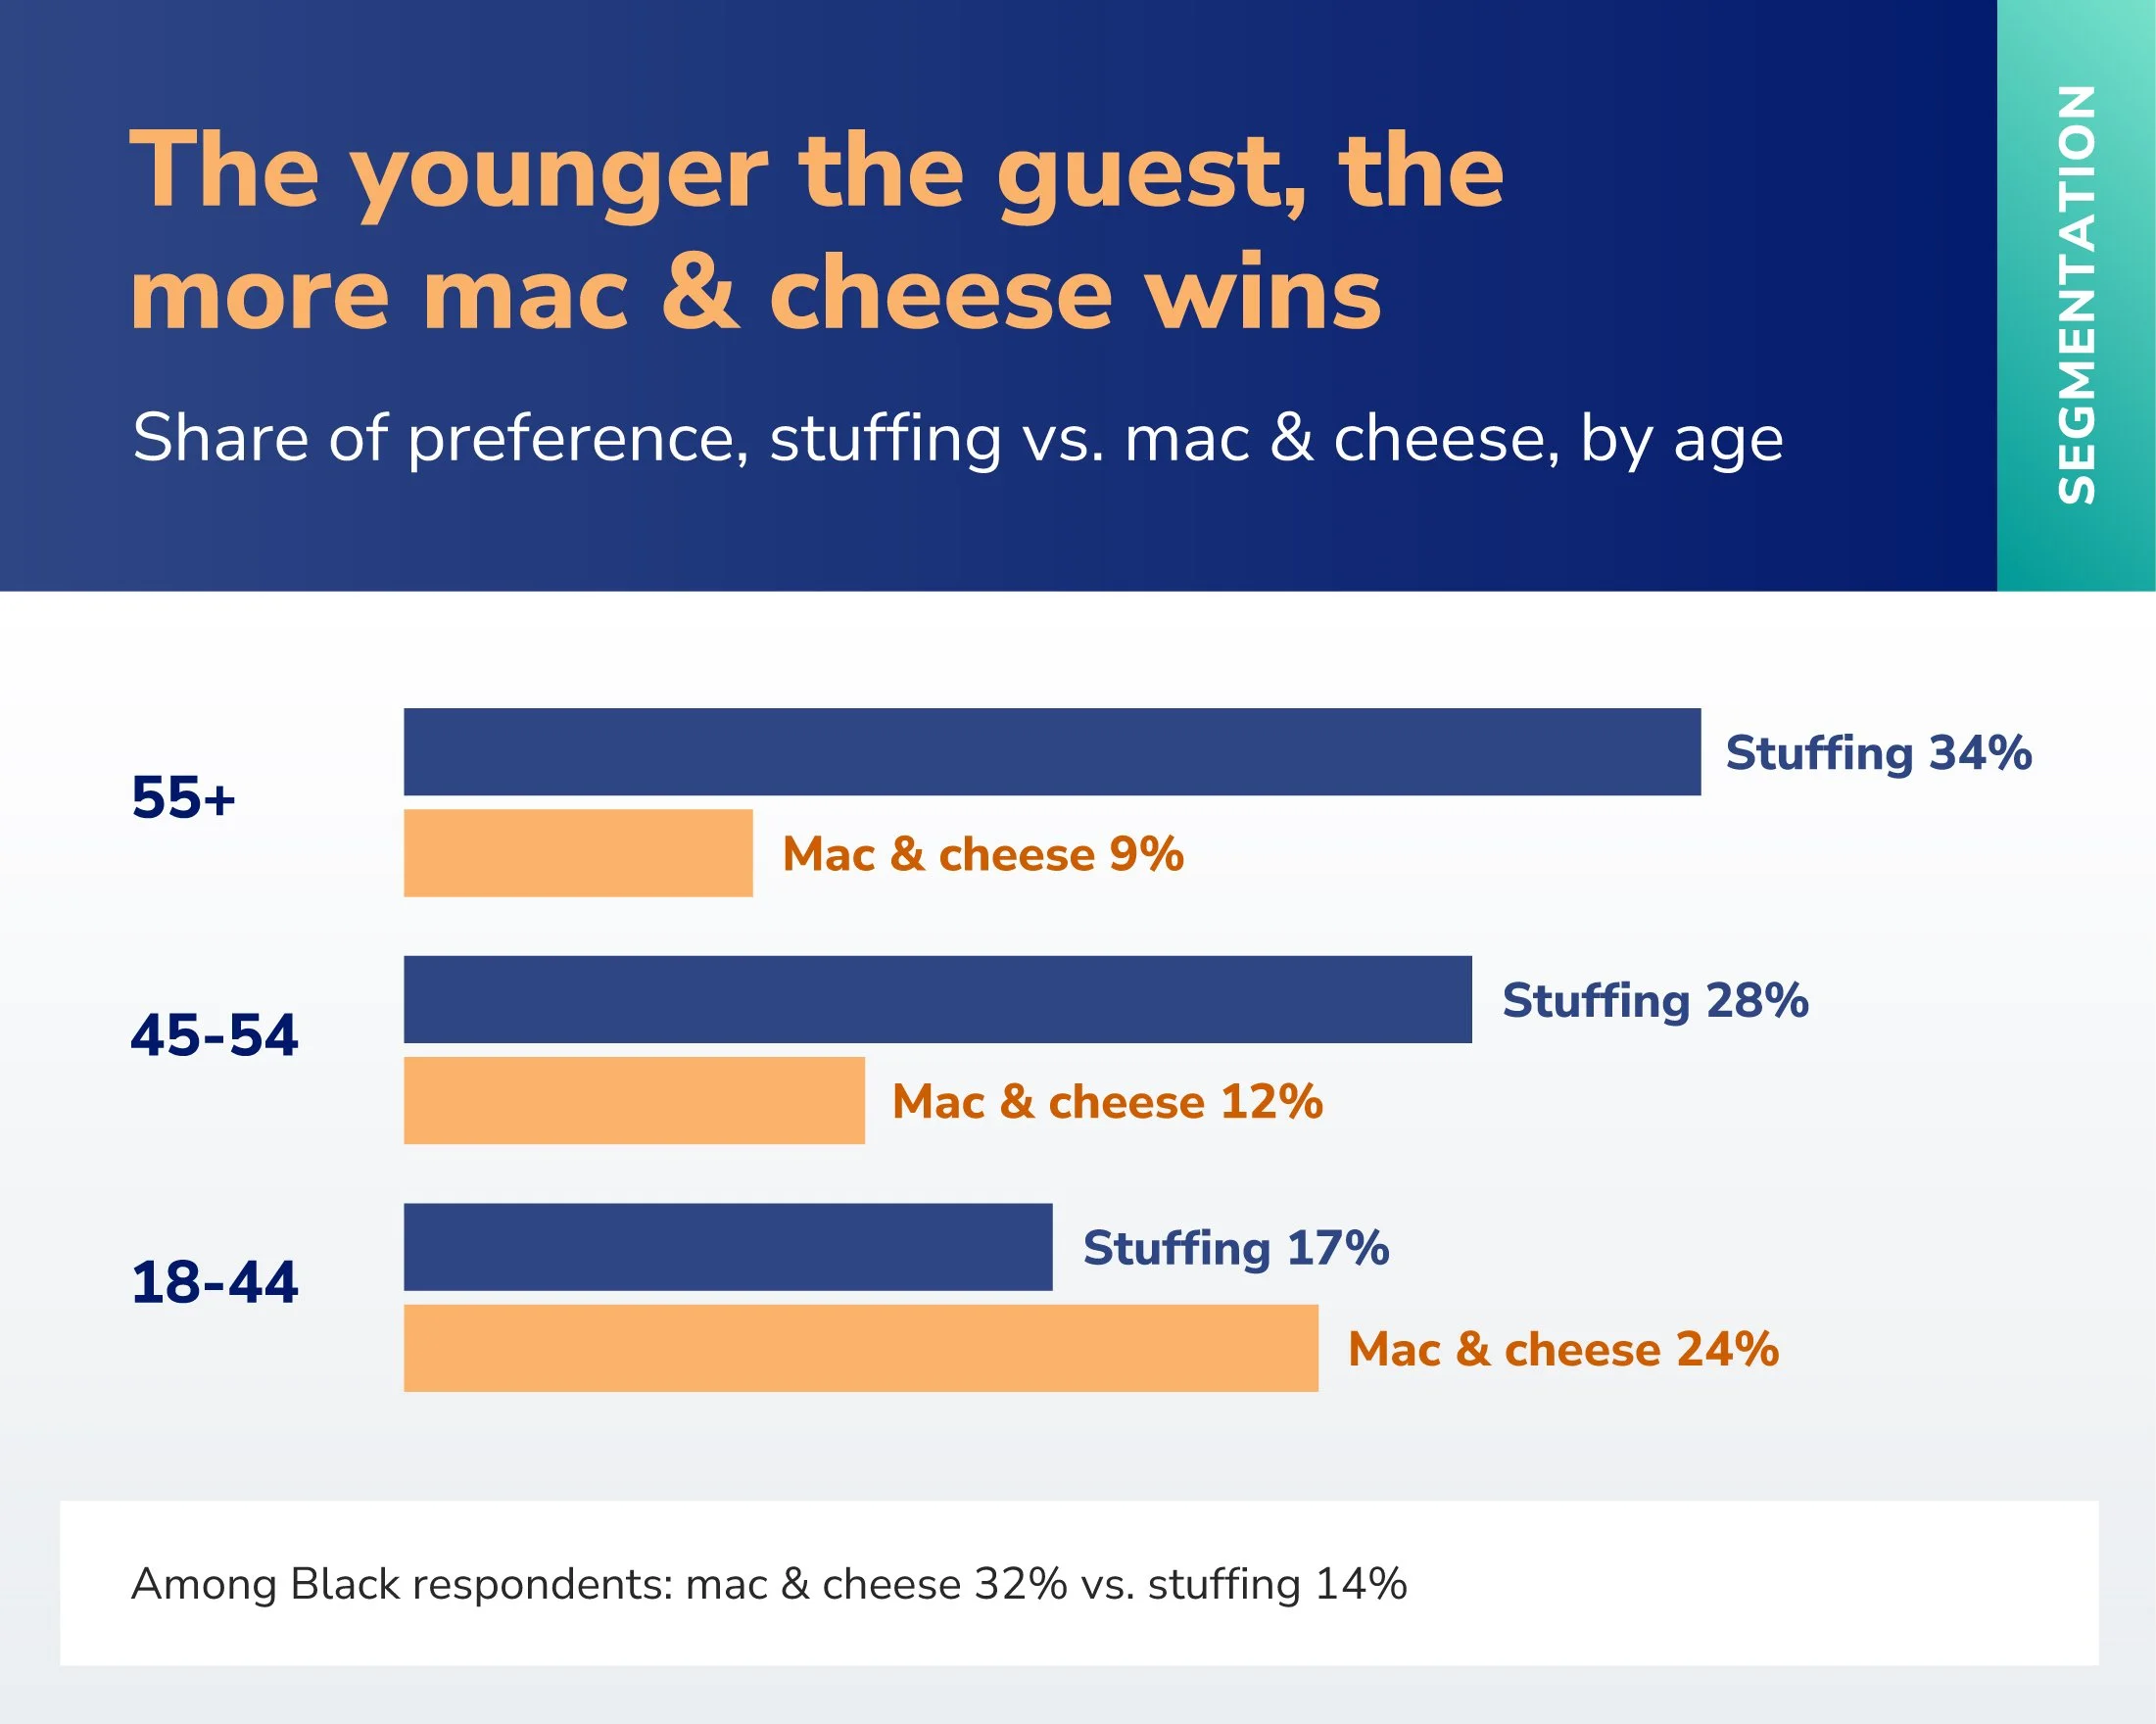
Culture matters as well. Among Black respondents, mac & cheese leads with 32% to stuffing's 14%, and collard greens carry real weight (8%, compared with 1% among White respondents).
WHAT IS SEGMENTATION ANALYSIS?
It means looking at the same results separately for meaningful groups of people, such as age, life stage, region, culture or buying behavior. Sometimes the groups agree. Often, they don't, and those differences can show where a brand is strong, where it's weak and where the category may be heading, just to name a few.
HOW BRAND LEADERS USE IT.
Total-market results show what's true on average, but most decisions land with specific customers. Looking at key segments shows where a product, message or offer is working and where it isn't, so you can target, tailor or prioritize. For example, a brand that tracks only total-market scores can look stable while it quietly loses younger buyers.
TURF ANALYSIS
Lesson 3: What’s most popular may not give you the most reach
Here's a practical question for any host: if you could only make a few sides, which ones would give the most guests at least one of their favorites? The obvious answer is to make the most popular sides. But popular sides tend to appeal to the same people, so the top few can still leave some guests without anything they love. TURF analysis looks at combinations instead.
WHAT IS TURF ANALYSIS?
TURF stands for Total Unduplicated Reach and Frequency. It tests every possible combination of options and finds the set that "reaches" the most people, meaning each person finds at least one thing they want. Here, a guest counts as reached if one of their own top three sides from the MaxDiff is on the menu.
HOW BRAND LEADERS USE IT.
The same approach can be used to pick a product line-up, the flavors in a variety pack, the features in a plan tier, or the three messages in a campaign. The question changes from "what's most popular?" to "what's the smallest set that covers the most customers?" That often saves money and keeps the niche option a popularity ranking would cut.
The best two-side menu is stuffing and mac & cheese, which reaches 85% of guests. Adding potatoes lifts that to 94%, and adding collard greens lifts it to 97%, as the chart below shows.
Picking by popularity doesn't do nearly as well. Potatoes and rolls, the two most-loved sides in the ratings, don't even make the ten best two-side menus, all of which reach at least 68% of guests. The three most-loved sides (potatoes, rolls and stuffing) don't make the top ten three-side menus either. People who love rolls mostly love potatoes and stuffing too, so adding rolls brings in few new guests.
The best fourth side shows how TURF thinks. Collard greens are a niche pick overall, but the people who choose them are often not reached by the big three. TURF looks for the option that adds new people, not the one that's most popular.
The pattern also tells you when to stop. Each added side brings in fewer new guests: the third adds nine points of reach, and the fourth adds just three. On a real project, that curve is how you choose the right number of options.
MENTAL AVAILABILITY
Lesson 4: Being remembered is its own advantage
Before we mentioned any brand, we asked a simple question for several Thanksgiving foods: when you think about buying this for Thanksgiving, what brand comes to mind first?
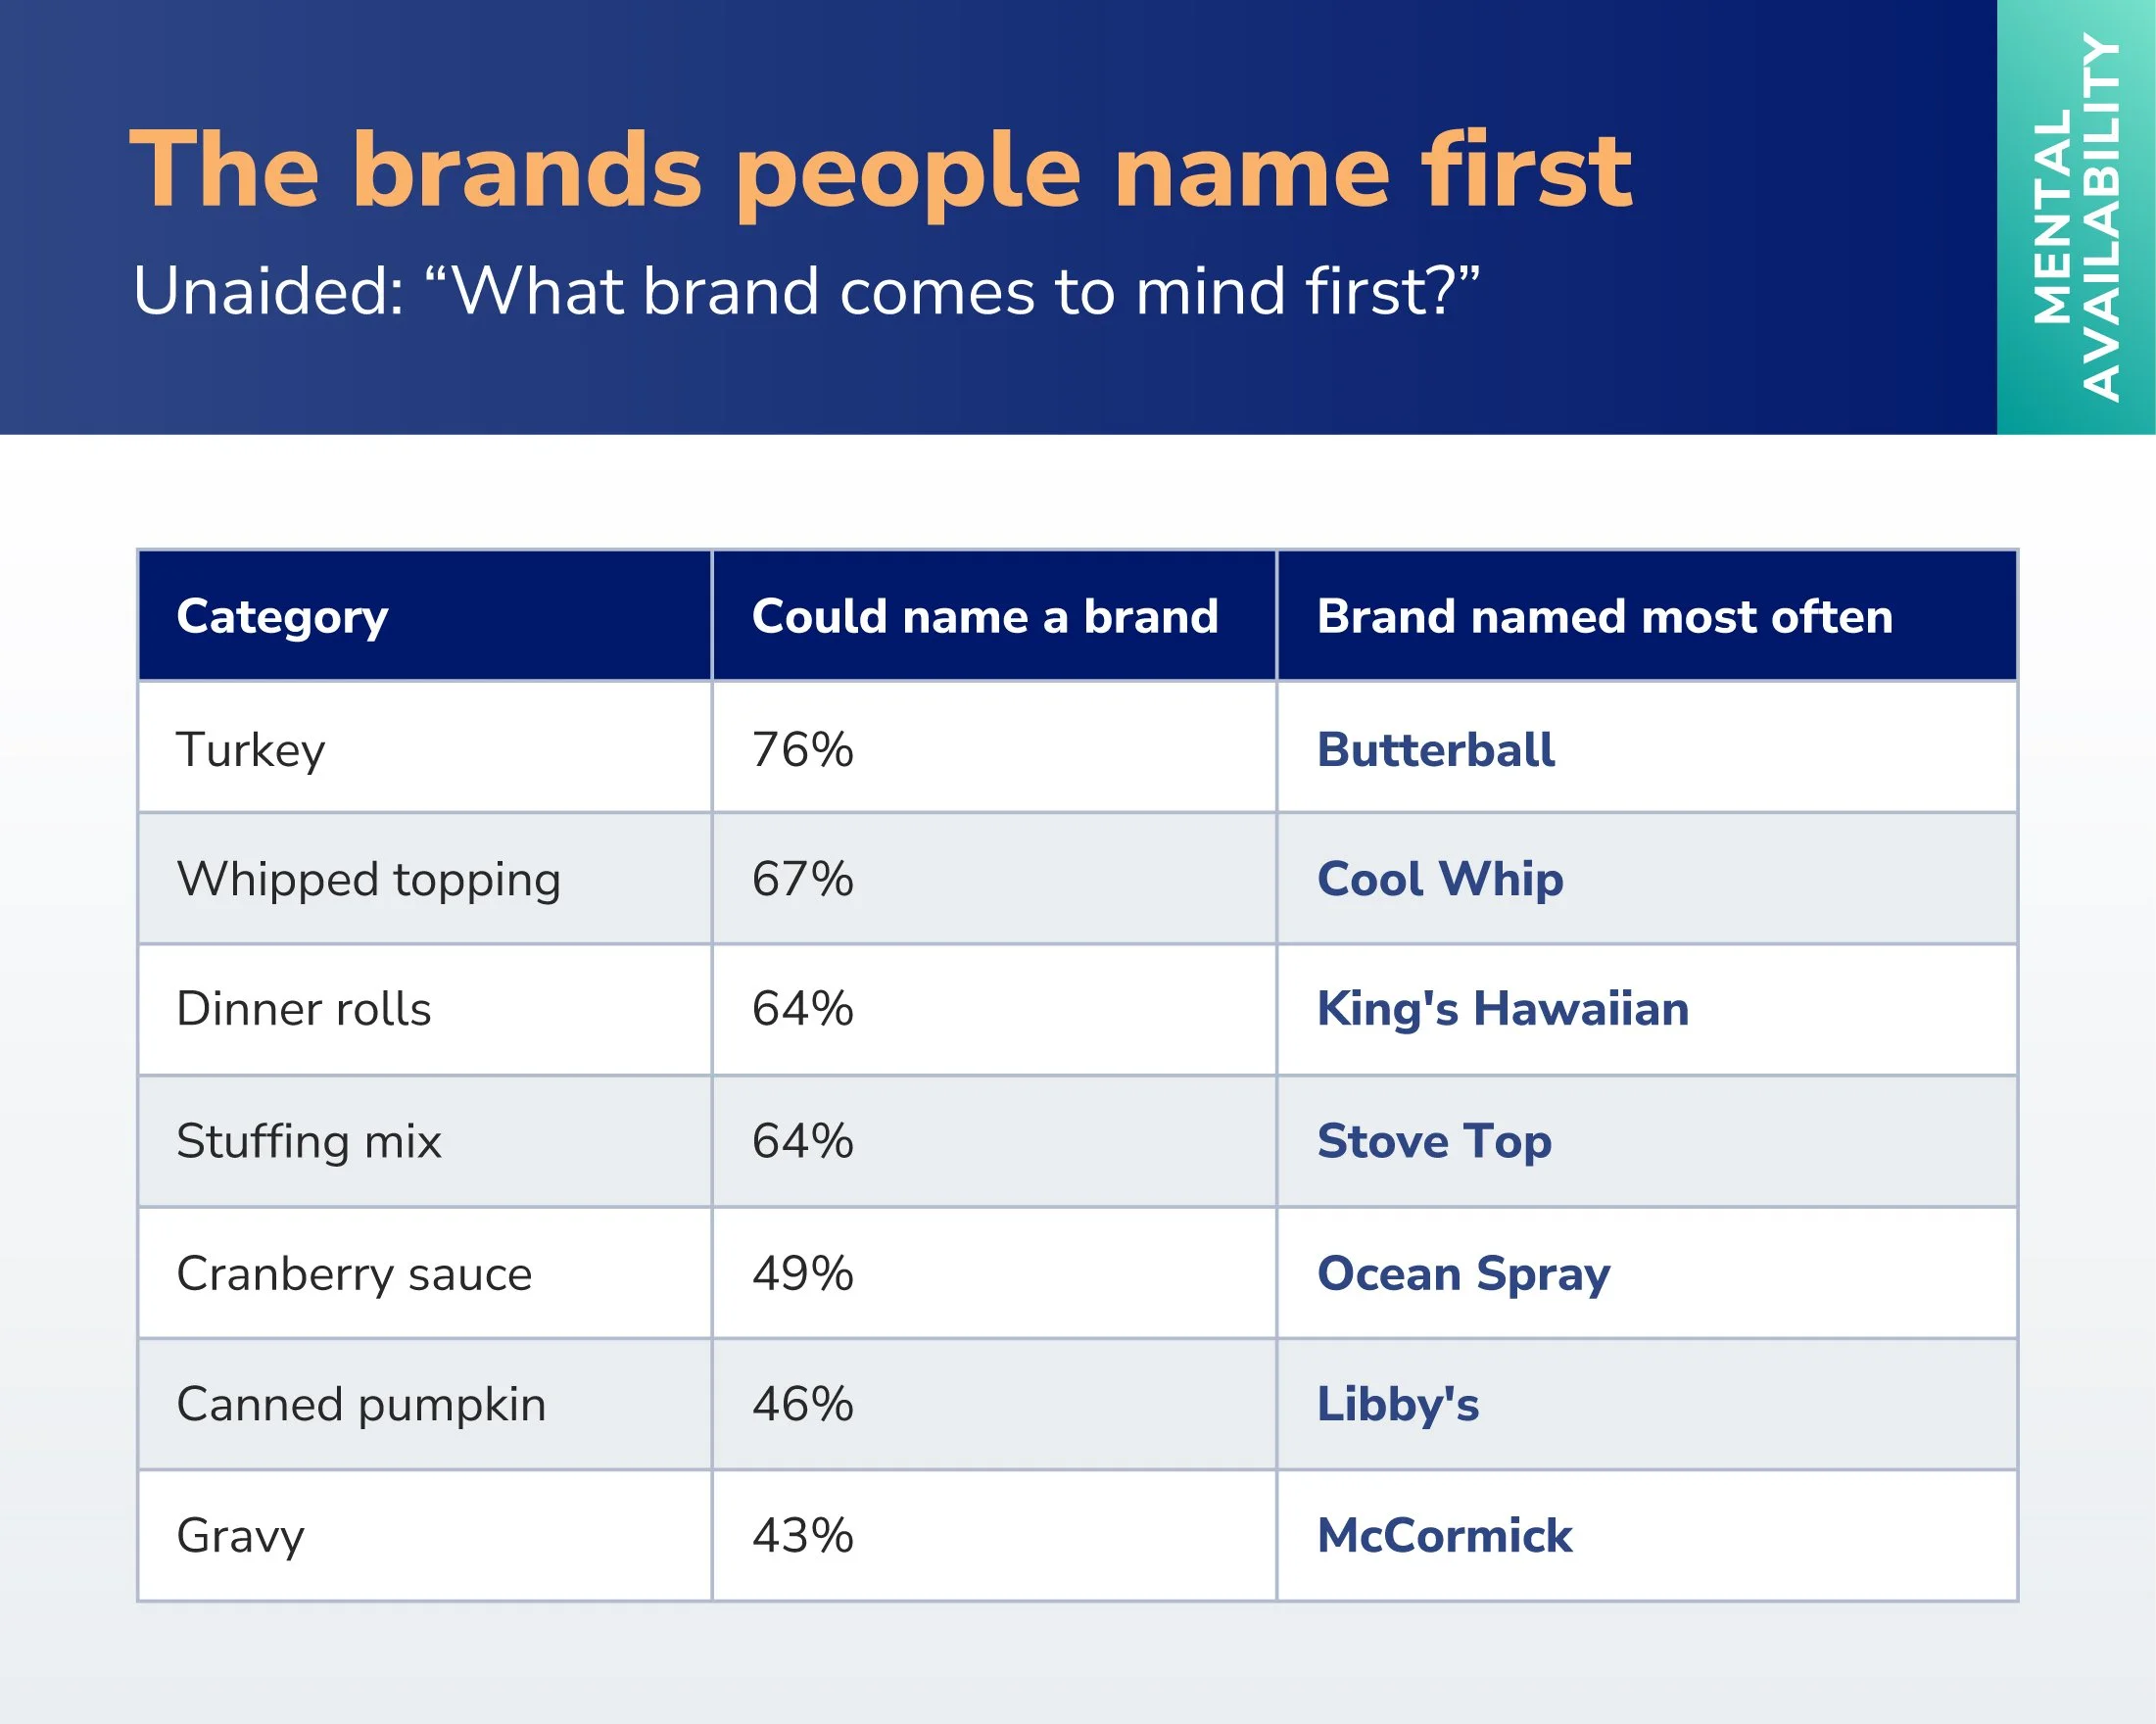
Butterball stands out. One in three people who named any brand, in any category, named Butterball. Many people answered the rolls question with just "Hawaiian rolls," so King's Hawaiian has nearly become the name of the product. Store brands such as Great Value were named by about one in six of those people, spread thinly across categories.
WHAT IS MENTAL AVAILABILITY?
It's a term from the Ehrenberg-Bass Institute for how easily a brand comes to mind in a buying situation. Thanksgiving is about as clear a buying situation as there is, and these brands have spent decades linking themselves to it. A simple way to measure mental availability is unaided recall tied to a specific moment: "what comes to mind when you need X?" asked before any brand names are shown.
HOW BRAND LEADERS USE IT.
Asking that question across a few key buying moments shows where a brand is the default and where the category is still open. It also shows which competitors own the moments you want, which is often more useful than a general awareness score.
The budget reality: almost no one expects Thanksgiving to cost less
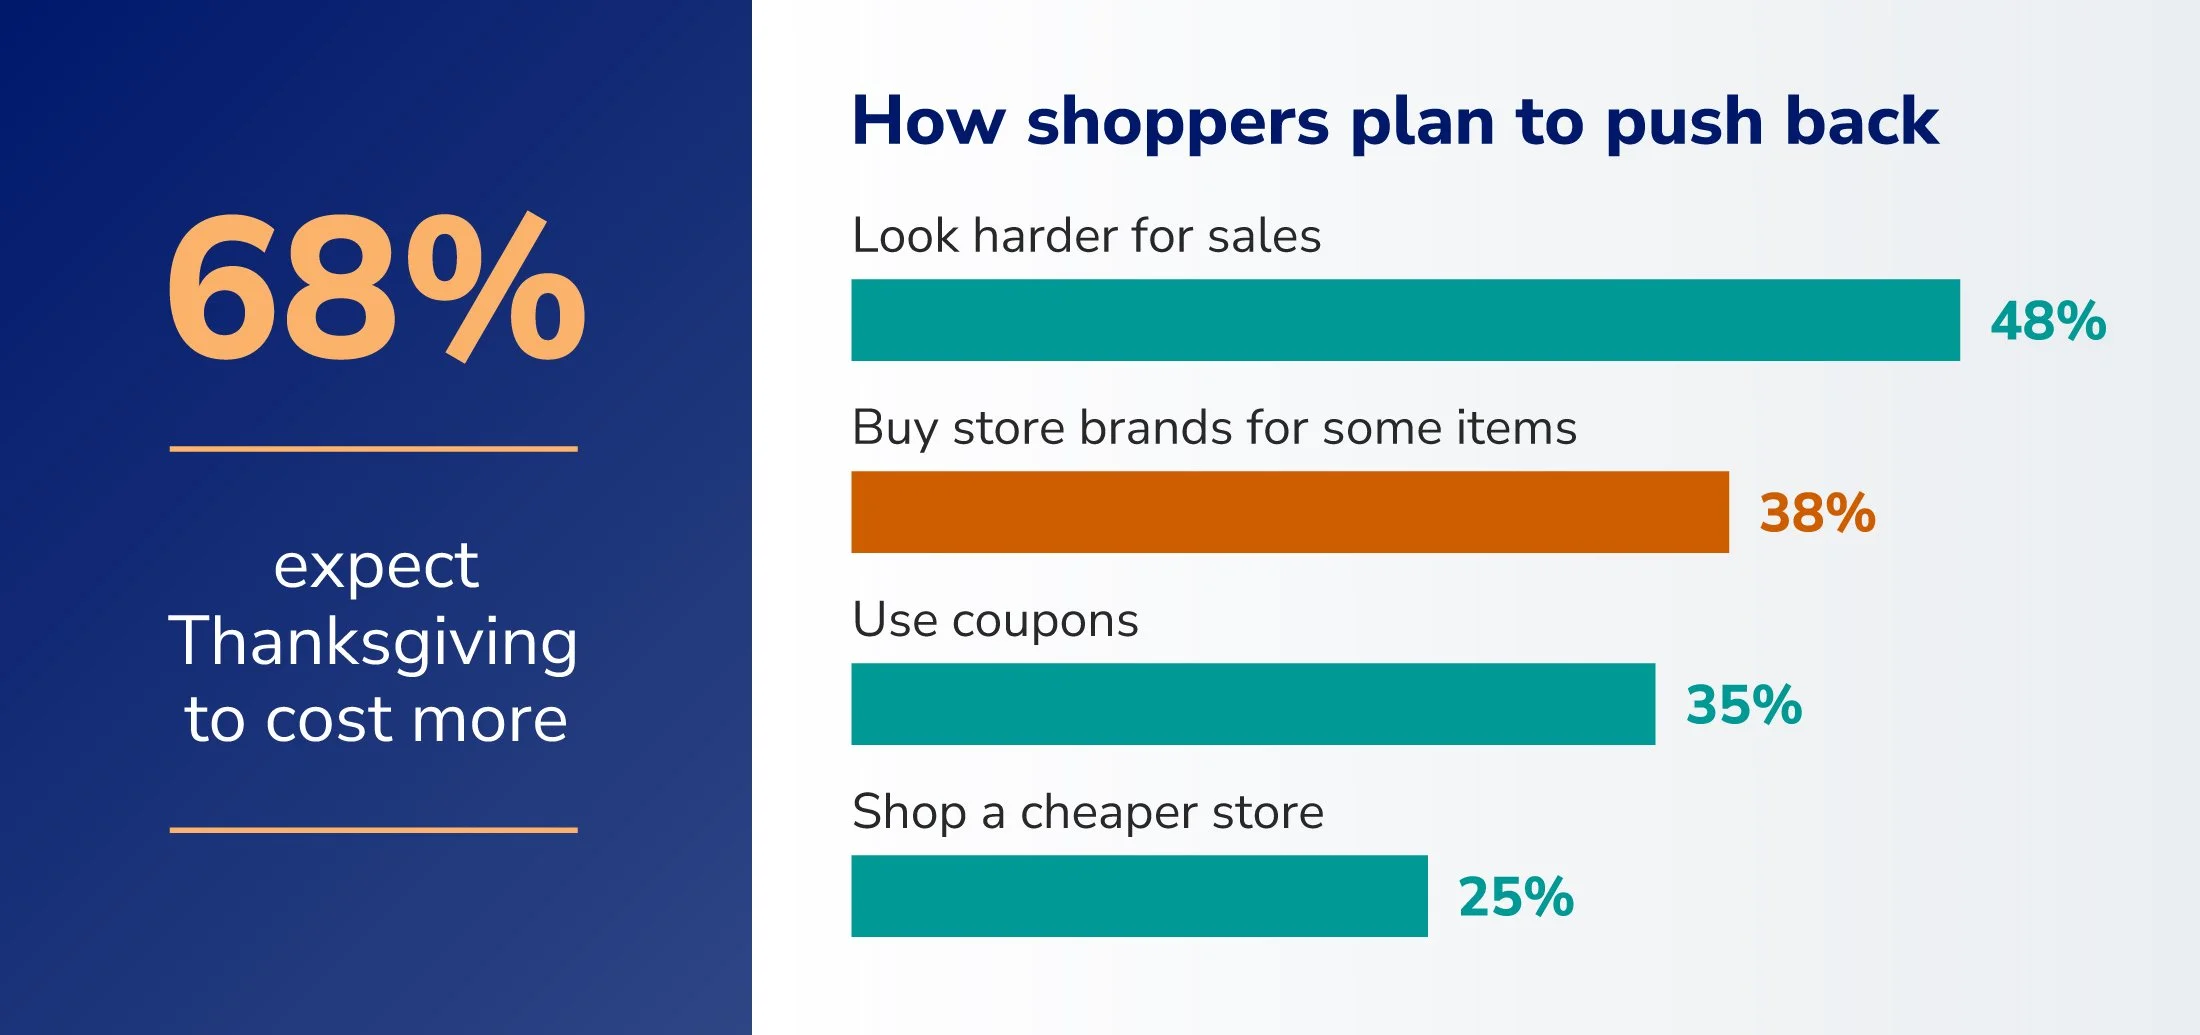
We fielded this study just before the U.S. midterm elections, with the economy dominating the conversation, so we also asked about budgets. Sixty-eight percent of people expect this year's meal to cost more than last year's, and only 3% expect it to cost less. Among those expecting to spend more, 74% point to higher food prices as the reason. About one in five say they're making more dishes or feeding more people, which we love.
Shoppers plan to push back in familiar ways: hunting harder for sales, switching some items to store brands, using more coupons and cash-back offers and, for some, shopping at a less expensive store.
That puts the brands in Lesson 4 in an interesting spot. They're the first names people think of, and many of the same shoppers plan to trade some items down. Being remembered gets a brand into the cart conversation, but it doesn't guarantee the sale when prices are top of mind (though it is a great defense!).
What this means for brand leaders
Thanksgiving sides are a light topic, but the lessons carry over to almost any brand decision.
Don't let a rating grid set your priorities. When people can like everything, they often will. Trade-off methods show what wins when customers have to choose.
Watch for your "corn." Some features and messages test well because they're pleasant and expected, not because they drive choice. They belong in the product, not at the top of the pitch.
Look at segments before averaging them away. A stable total can hide a generational shift that will matter for the next five years.
Build line-ups for reach, not popularity. The best set of options includes the one that brings in new people, even if it isn't the most popular on its own.
Measure mental availability in real buying moments. Ask what comes to mind when customers need the category, not just whether they recognize your name.
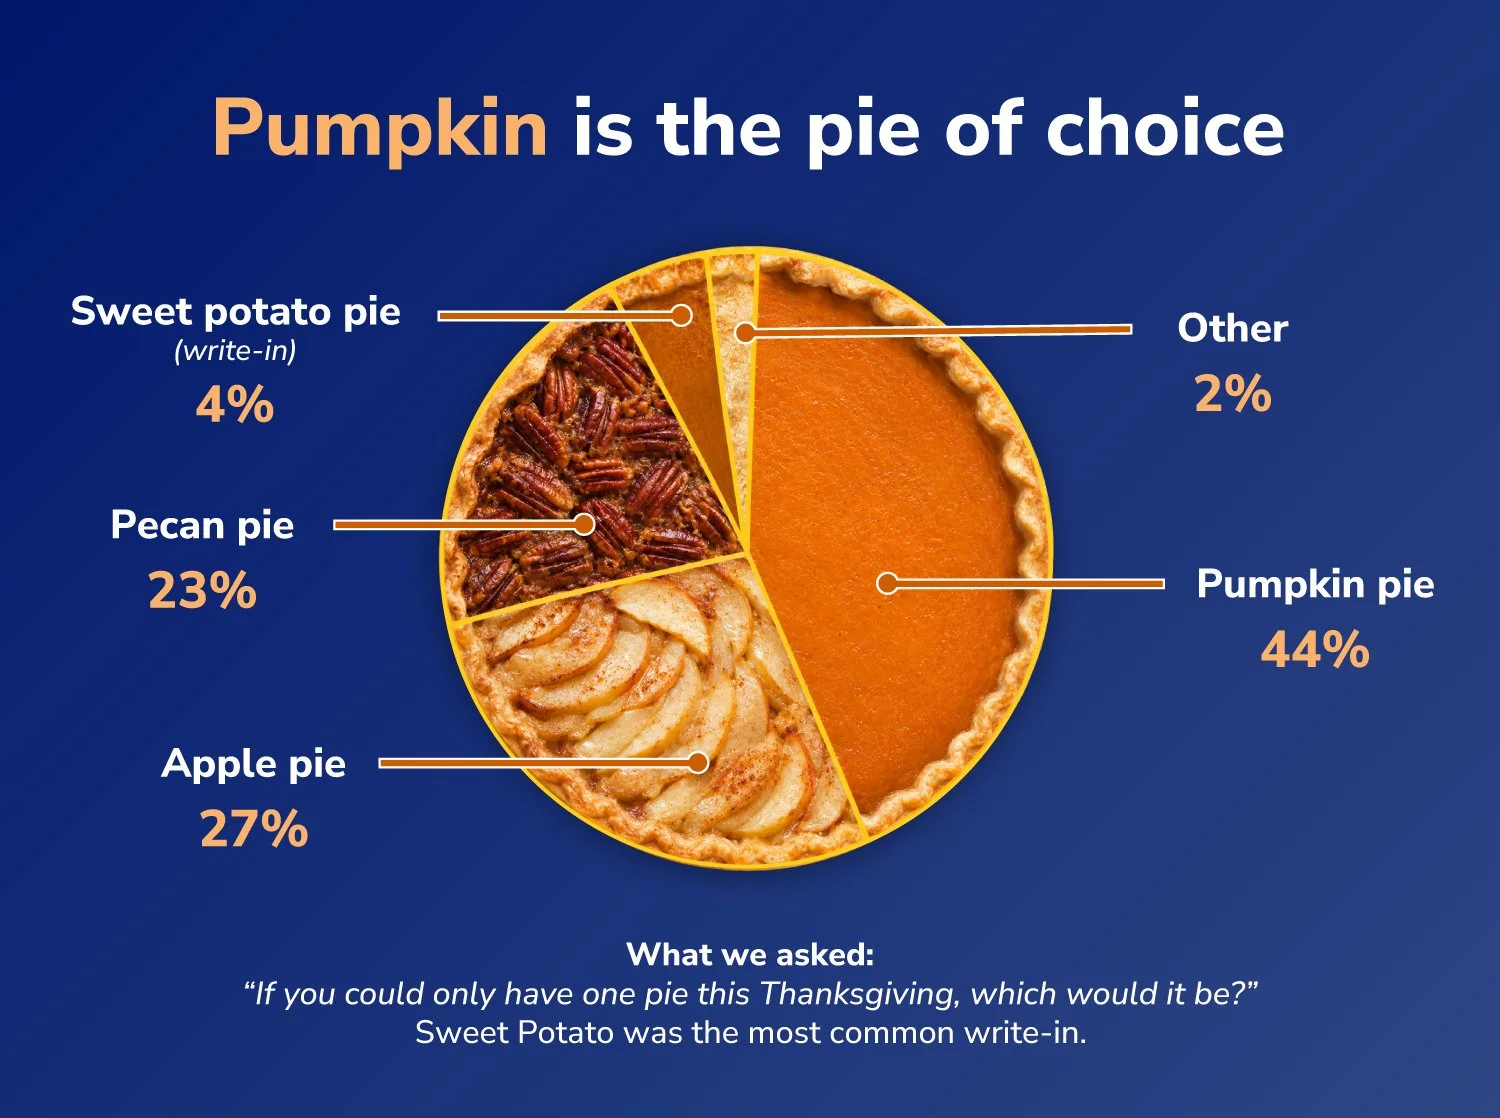
And… for the record, if people could have only one pie:
Pumpkin pie is the clear winner at 44%, with apple and pecan in the distance at 27% and 23%, respectively. Sweet potato pie was the most common write-in.
How we did the study
Qwerry surveyed 470 U.S. adults aged 18 and older who expected to eat a Thanksgiving meal in 2026. The online survey was fielded October 20 to 23, 2026, using a nonprobability panel sample. Results are weighted to U.S. adult benchmarks for gender, age, region, race and income. The MaxDiff covered 13 sides in eight rounds of five and was analyzed with a hierarchical Bayes model to estimate each person's preferences. The TURF analysis used each person's top three sides.
