
How to Validate Demand for a New Location
Combining market research with geodemographic (GIS) data to find out whether enough people will actually come.
OCTOBER 21, 2026 | BY JOSEPH DONNELLY, QWERRY
The Idea in Brief
THE CHALLENGE
Opening or expanding a physical location is a capital bet on one question: will enough people come, at the price you need? Too many operators answer it with gut feel, borrowed benchmarks, or raw enthusiasm for the concept.
WHY IT HAPPENS
Each data source alone is incomplete. Population counts can’t show intent. Survey percentages have no population attached. Neither one, by itself, is a projection.
THE SOLUTION
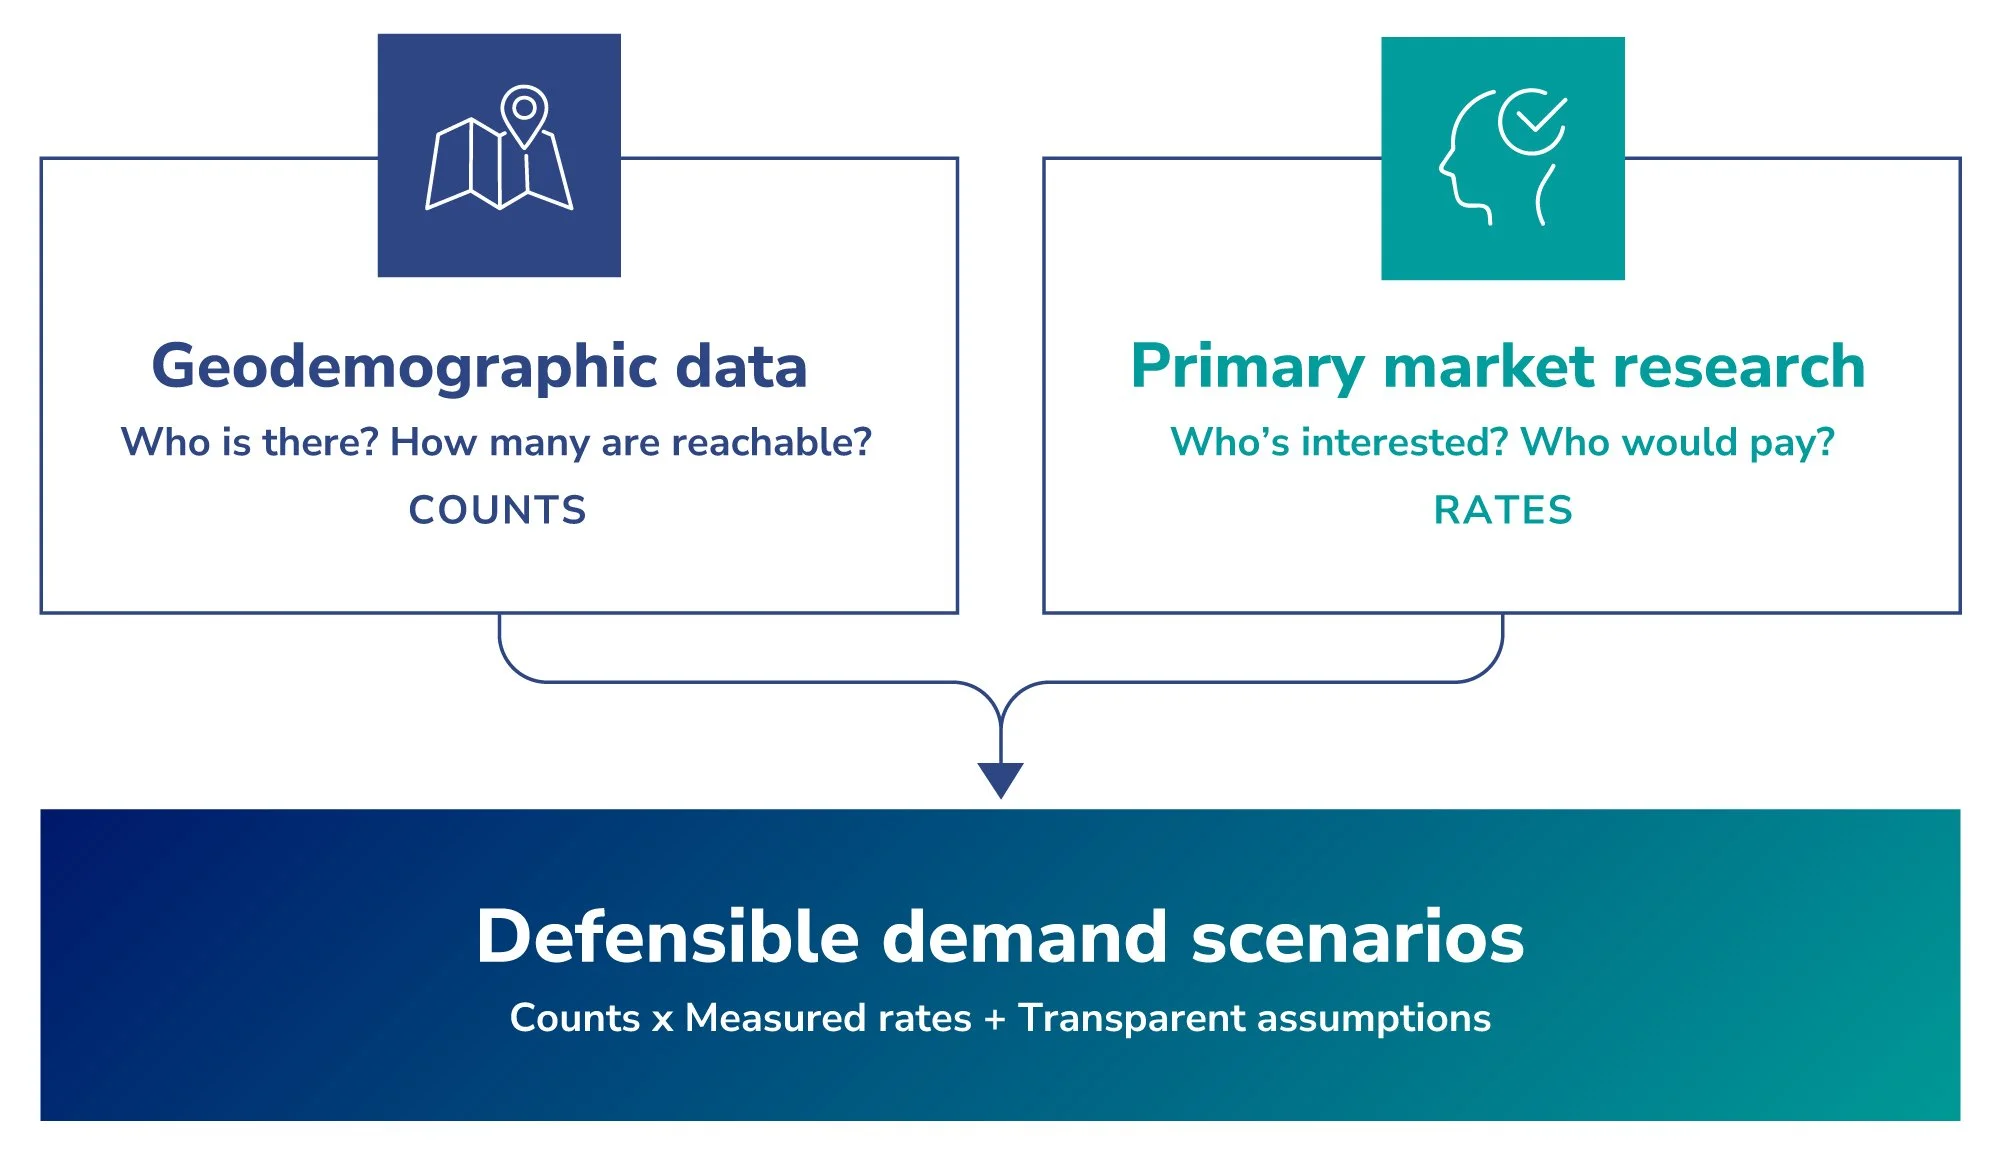
Combine the two. Geodemographic (GIS) data counts who is realistically around your site — the denominators. Primary market research measures how those people respond to your concept — the rates. Multiplied together, with every assumption labeled, they produce demand scenarios an investor, lender, or board can interrogate.
Will enough people actually come?
If you’re opening or expanding a physical business with an address — a school, a restaurant, a swim facility, an entertainment venue, a clinic, a store — you or your investors will eventually ask the only question that matters: will enough people come, and at the price you need, for the business to be successful?
The reliable way to answer that combines two kinds of data: geodemographic data, pulled from GIS mapping tools, that counts who is realistically around your site — and primary market research that measures interest, fit, willingness to buy, and other concept test KPIs. Alone, each gives you some useful information. Together, they give you evidence-based projections to build your business plan upon. This article explains both, and how they fit together.
One scope note: this applies to brick-and-mortar, location-based businesses — anywhere customers physically show up. If your market is national and digital, you still want validation, but geography won’t be the backbone of it.
What is market validation research?
Market validation research measures whether real, sufficient demand exists for a specific offer in a specific market — before you commit capital. For a physical location, it combines geographic population data with primary research into how target customers react to a concept, producing demand estimates a lender, investor, board, or bootstrapper can interrogate.
What geodemographic data tells you: who is really around your site
Geodemographic data is census and market data organized around your actual site. From GIS tools, you can pull data for your defined area such as:
Households and population — including the slices that matter to you, like children by age band or households above an income threshold
Growth and mobility — whether the base you’re counting on is rising or thinning
The competitive landscape — who already serves this area, and where the gaps are
Market potential — category spend and category-market-potential indicators from trusted syndicated data sources (for example, what share of adults in a county participated in a given activity last year, or whether spend in a ZIP code is above or below average for your product category)
Those last layers are useful context, but they’re general by nature — modeled from national syndicated data, not from your market answering questions about your concept specifically. What geodemographic data gives you is a real count; the denominators you’ll use to forecast demand. What it can’t tell you is whether any of those counted people want what you’re building.
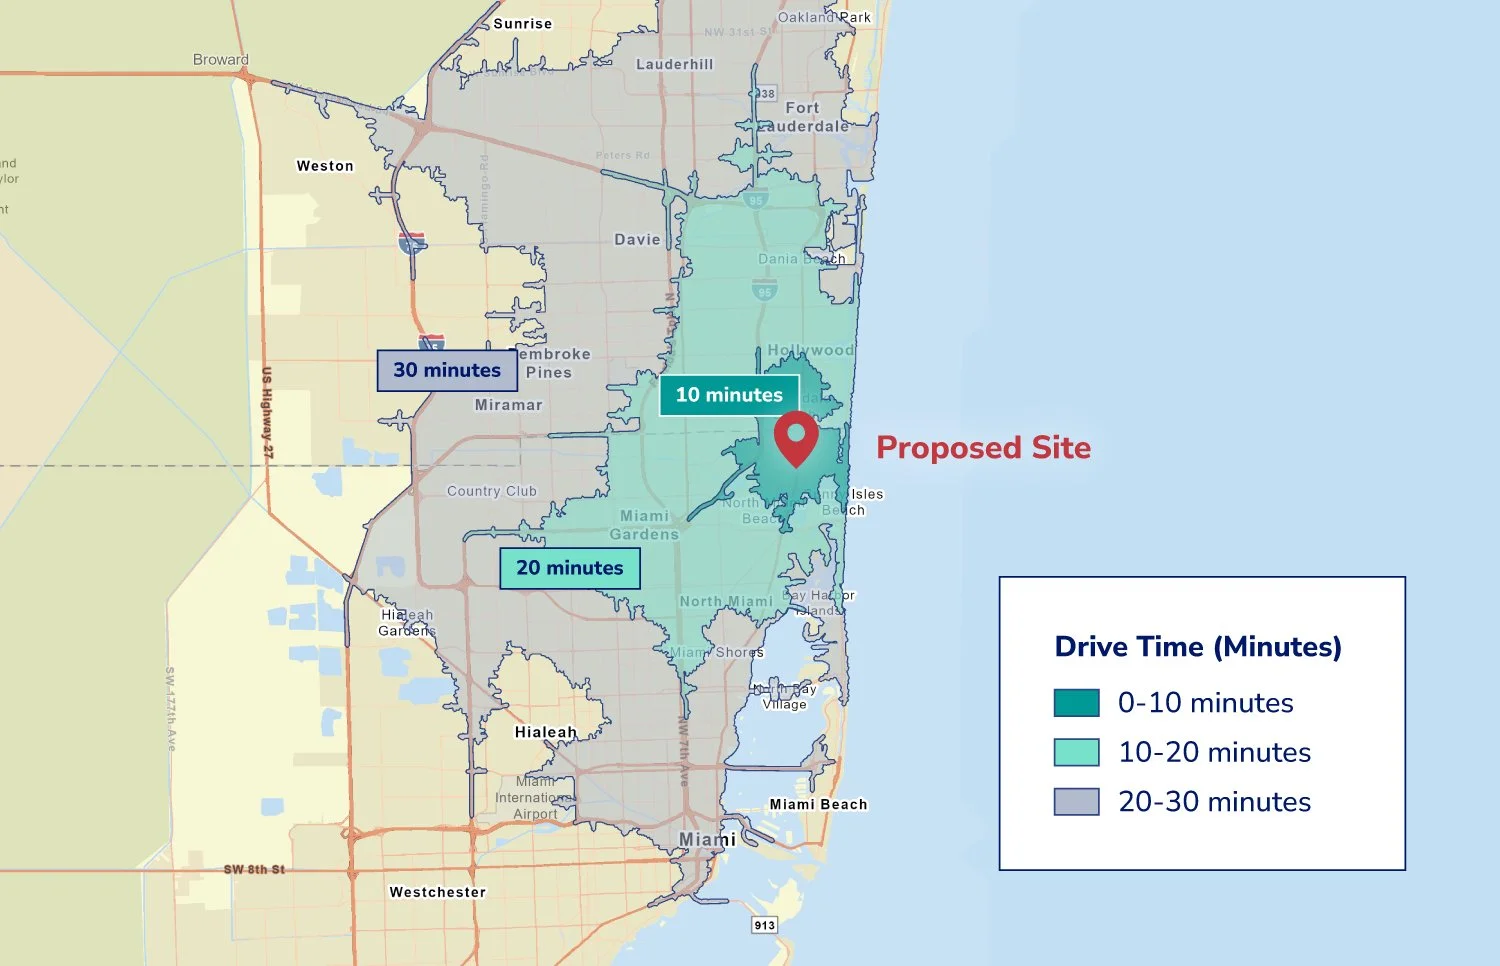
It also keeps you honest about geography itself. In our recent demand studies, the market the operator assumed rarely matched what drive-time analysis showed — in one case, the brand’s priority zone was largely a category desert in one direction, while the opportunity for expansion was on the other side of the city. In another client’s study for a new swim facility, the mapping analysis confirmed assumptions and uncovered other bonus findings about the geographic landscape — creating confidence in the effort early. Either way, a strong mapping analysis earns its keep before the first survey question is ever asked: whether it redirects your plan or confirms it, every projection that follows is built on ground you’ve actually measured.
What primary market research tells you: how those people respond to your concept
The second dataset comes from primary research: a custom survey of the right audience — the people who match your customer profile, in the geography you just defined. Where the GIS layers provide numbers about population that help you size the overall market and contextual spend data or other indicators, the primary research is 100% specific to your concept and your market. A demand study typically measures:
Concept reaction — interest, fit, and how different your offer feels against what’s available today
Consideration — whether people are likely to consider your offer
Willingness to pay — how that demand holds up at the prices your model needs (or a separate pricing module to help determine your revenue-optimizing price)
Willingness to travel — how far people will realistically go for an offer like yours
This primary research gives you real response rates from real potential customers. But on its own it has the opposite blind spot: a percentage with no population attached isn’t a projection. “68% open to switching” means nothing for a financing case until you know how many qualified people that percentage describes.
“A percentage with no population attached isn’t a projection.”
QWERRY DEMAND VALIDATION PRINCIPLE
Where the two datasets click together
The combination is simple to state: geodemographic data supplies the counts, and market research supplies the rates that apply to them.
Even at its most basic, that’s valuable — if you already know your draw area, GIS gives you trustworthy numbers for exactly that geography, instead of a county statistic that includes people who will never pass your door. When distance is an open question, the join gets sharper: survey-measured willingness to travel weights each drive-time ring, turning “people nearby” into “people realistically within reach.”
Here’s the shape of it, from a recent study for an education operator (numbers rounded and anonymized):
~26,000 income-qualified children in the defined catchment — counted from census data by drive-time ring
~18,000 realistically reachable — each ring weighted by parents’ measured willingness to travel
~10,000 in households both open to switching and likely to consider the concept — measured in the survey
Opening scenarios — conservative to aggressive capture assumptions, each labeled as an assumption and documented
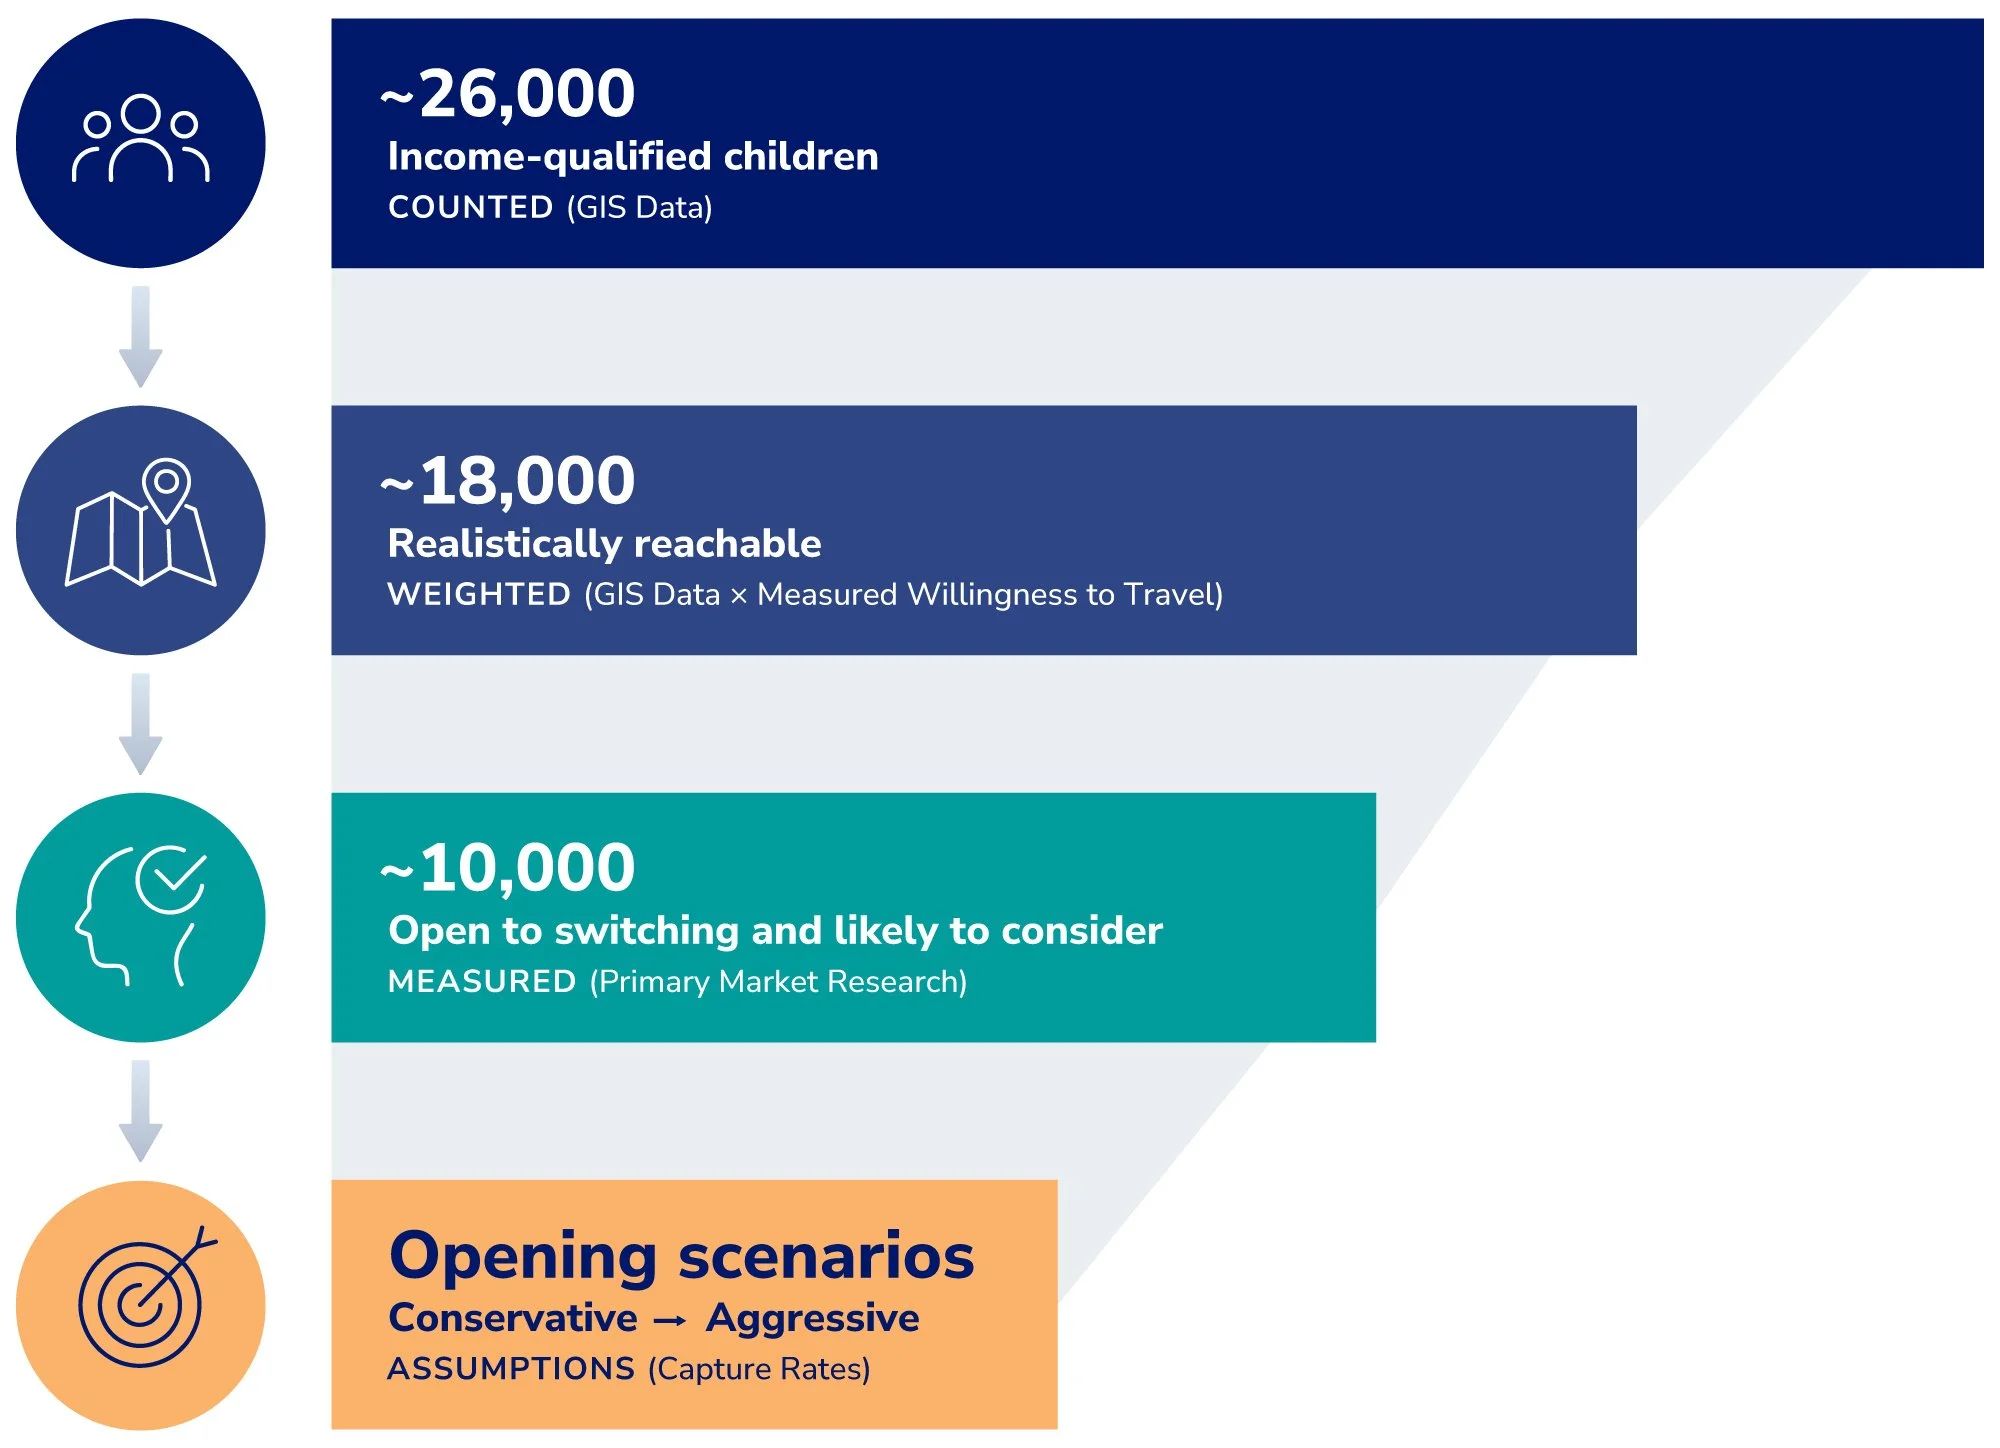
Every number in that chain is either counted or measured — and the one that’s neither (the capture rate) is explicitly labeled as an assumption based on your marketing plan, and often includes a good-better-best range of scenarios. That transparency built on defensible geodemographic and primary research data is what makes demand validation outputs credible to investors, lenders, partners, boards, or even just bootstrappers.
What you end up with
A demand estimate that’s grounded on both sides: counted people (meeting your target criteria) on one, measured behavior on the other. In practice that means scenario ranges rather than one confident number, assumptions documented where anyone can challenge them, and sanity checks against real-world supply — if your model implies more demand than the market’s existing capacity can explain, you want to know why before your banker asks.
And while this article focuses on validating a new location, the same pairing — market research × geodemographic data — powers brand and category work too: understanding who your market really is, where they are, and how they choose.
Common questions
What if my local market is small — can a survey even work?
Yes, with the right design. We size the local sample cells for the core counts the model needs, and when deeper analysis (like choice drivers or pricing models) needs a higher sample size, we also survey the same-category audience over an expanded geography. This gives us the N size we need to run models using the same type of category respondents: local results answer “how many here”; the expanded sample strengthens deeper research outputs on mindset… the “why, and what moves them.”
Why drive time instead of a radius?
Because a five-mile circle can hide a 35-minute drive. Rivers, highways, traffic patterns, and urban congestion shape who can realistically reach a site, and drive-time rings reflect how people actually move. They rarely look like rings. Two sites with identical radius populations can have very different reachable markets based on transit time.
Can’t I just use benchmarks from similar businesses?
Benchmarks are useful sanity checks, but they describe someone else’s market, concept, and competition. Financing partners increasingly expect demand evidence from your market — your geography counted, your customers measured.
How long does a market validation study take?
The geographic foundation alone can be an early, lower-cost read before committing to the full study, and this can be as quick as a week or two. A typical combined study runs about 8–10 weeks: geographic foundation first, then the primary research, then integrated demand modeling.
Where to go deeper
Read our article Concept Testing: Research Methods and Examples for more information about concept tests. In upcoming articles we’ll go further on two pieces of this method: how we actually build a catchment (drive-time rings, travel weighting, and whitespace mapping), and how a demand study feeds a defensible TAM/SAM/SOM.
Weighing a new location or expansion? Qwerry builds financing-ready demand validation for location-based businesses — qwerrybrands.com.
